
More than a quarter of children live in poverty across Mississippi — and those children are more likely to live in unhealthy parts of the state and see health complications into adulthood.
New health rankings from the Robert Wood Johnson Foundation show that economic and social factors can influence health just as much as the vitals collected in the examination room.
The report shows all 82 Mississippi counties have health issues, including obesity, HIV prevalence and high rates of uninsured people — but some fare better than others. The main takeaway from the annual report: place matters — a person’s zip code is a robust indicator of their ability to live a well life. Every county across the state has at least a 30 percent adult obesity rate.
The healthiest counties are Rankin, followed by Madison, DeSoto, Lamar and Lafayette. The five counties in the poorest health, starting with the least well, are Quitman, Jefferson, Holmes, Coahoma, and Sharkey.
But notably, within the well counties, African Americans still experience impoverished health outcomes, signaling that health outcomes are not shared across race in otherwise healthier counties.
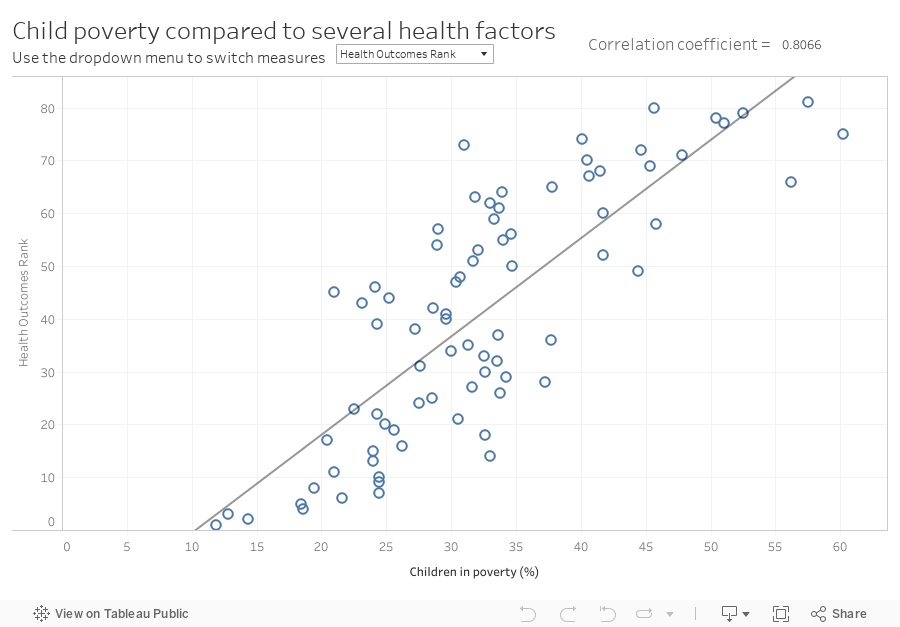
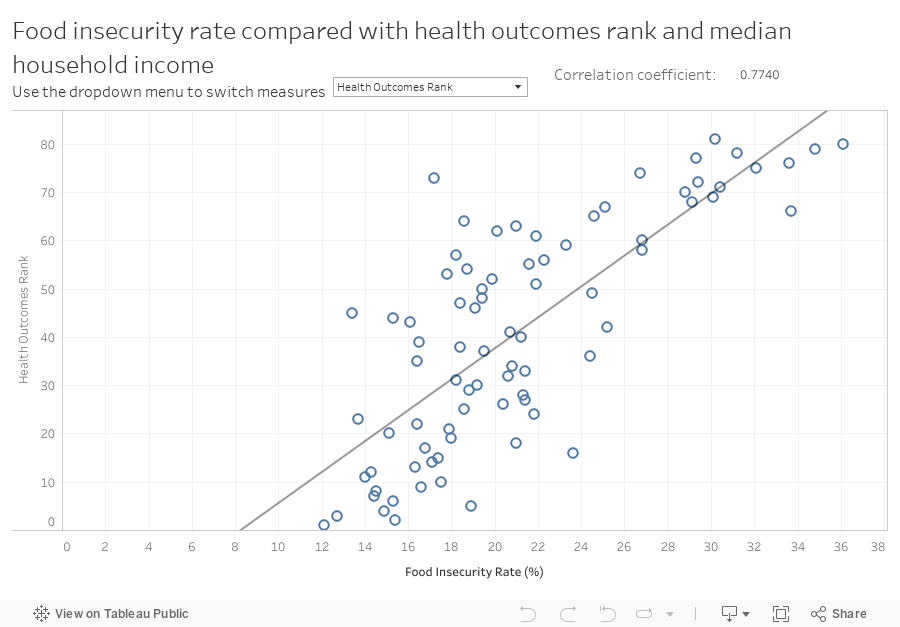
In Mississippi, social and economic determinants such as food deserts, child poverty and median income are the strongest indicators of a county’s health outcomes. A Mississippi Today analysis looked at the relationship between those determinants and various health factors, as seen in the scatter plots below (methodology on correlations at bottom of story).
For example, a family’s income is strongly connected to their health outcomes — the lower the income, the worse the health ranking.
var divElement = document.getElementById(‘viz1553015545903’); var vizElement = divElement.getElementsByTagName(‘object’)[0]; if ( divElement.offsetWidth > 800 ) { vizElement.style.width=”900px”;vizElement.style.height=”627px”;} else if ( divElement.offsetWidth > 500 ) { vizElement.style.width=”900px”;vizElement.style.height=”627px”;} else { vizElement.style.width=”100%”;vizElement.style.height=”727px”;} var scriptElement = document.createElement(‘script’); scriptElement.src=”https://public.tableau.com/javascripts/api/viz_v1.js”; vizElement.parentNode.insertBefore(scriptElement, vizElement);
var divElement = document.getElementById(‘viz1553015926181’); var vizElement = divElement.getElementsByTagName(‘object’)[0]; if ( divElement.offsetWidth > 800 ) { vizElement.style.width=”900px”;vizElement.style.height=”627px”;} else if ( divElement.offsetWidth > 500 ) { vizElement.style.width=”900px”;vizElement.style.height=”627px”;} else { vizElement.style.width=”100%”;vizElement.style.height=”727px”;} var scriptElement = document.createElement(‘script’); scriptElement.src=”https://public.tableau.com/javascripts/api/viz_v1.js”; vizElement.parentNode.insertBefore(scriptElement, vizElement);
var divElement = document.getElementById(‘viz1553015936757’); var vizElement = divElement.getElementsByTagName(‘object’)[0]; if ( divElement.offsetWidth > 800 ) { vizElement.style.width=”900px”;vizElement.style.height=”627px”;} else if ( divElement.offsetWidth > 500 ) { vizElement.style.width=”900px”;vizElement.style.height=”627px”;} else { vizElement.style.width=”100%”;vizElement.style.height=”727px”;} var scriptElement = document.createElement(‘script’); scriptElement.src=”https://public.tableau.com/javascripts/api/viz_v1.js”; vizElement.parentNode.insertBefore(scriptElement, vizElement);
This year, the rankings added housing factors, including home ownership and severe housing cost burden — a measure of how many households pay more than half their income on housing costs, usually rent and utilities. “We highlighted housing as an important health issue and factor that influences health,” said Kate Konkle, associate researcher at University of Wisconsin’s Population Health Institute, which partners with the Robert Wood Johnson Foundation to create the rankings.
“If you’re spending more than half of your income on housing, where you live, it leaves not very much money left for other necessities like food, health care and medicine and transportation to work and school supplies,” she said. “It really starts to create issues in other areas we know are important both for quality of life and for health.” Additionally, high housing cost burdens are associated with general housing instability and issues like eviction and homelessness.
Unequal housing burdens highlight racial disparities across health factors. Overall, 14 percent of Mississippi households spend more than half of their income on housing costs. But, when broken down by race, African American households are cost burdened at more than double the rate of white families — at 20 and nine percent respectively. While the overall cost burden across the state might not be as stark as other states, the racial disparities are telling and impact health outcomes, says Konkle. “When you start to look a little deeper, it does start to show some significant difference.”
People that pay more of their income on rent are often effectively barred from home ownership, Konkle added. Renting tends to be the most cost-effective option for people with low incomes, but it can also compound poverty because it can be more pricey in the long run. “Not only are you then struggling to pay for all these other things you need day to day, but you don’t have the savings to eventually be on the path to home ownership, which we know can bring security and also wealth building for families.”
Konkle also pointed to the array of solutions the project offers for various health crises.
“The whole reason that we give people data is that we want them to do something with it,” she said. “We want to give them support to take action.”
Users can search the “What Works for Health” section of the website, a menu of about 400 strategies connected to the different factor areas.
Methodology: The correlation coefficient measures how closely two series of data are connected. Visually, the closer the dots are to the diagonal line, the stronger and more telling the correlation. A coefficient of 1 means a perfect positive relationship (i.e. as data series X increases or decreases, data series Y does the same), and -1 means a perfect negative relationship (as X increases or decreases, Y does the opposite). Coefficients above 0.5 and below -0.5 are considered robust correlations. The 2019 County Health Rankings included a health outcomes ranking for all 82 counties except Issaquena. The rankings were distributed 1 through 81, with 1 being the best and 81 the worst.